Web Performance: Make your website faster
Learn how to make your website faster thanks to a systematic approach, diagonostic tools, common issues and their solutions.

In a previous post, I explained how to get started with web performance by measuring and reporting on how your users experience your website using web vitals. Once you have a good picture of where you stand and how you compare to your competitors, you are ready for the next step, which is to actually make your site faster.
A systematic approach: diagnose, fix and validate
You can easily resolve web performance issues by following a systematic process: diagnose, fix, validate. First, you look for the root cause of the issue using diagnostic tools, then you need to understand the issue and take some time to evaluate possible solutions.
Once you have identified, implemented, and deployed a solution, you should be able to validate that it works. Initially with synthetic tools, and in a best case scenario, you should be able to run an A/B test to validate the solution and its impact on your users, or at least you should be able to see a shift in the field metrics you started to report and measure.
You will probably want to start with the metric you are the worst at, as this is where you will likely see the highest return on investment. If nothing stands out, I would recommend starting with Cumulative Layout Shift (CLS) as in my experience this is the easiest metric to optimize for and you will quickly be able to improve your users’ experience.
Diagnostic tools
Chrome Dev Tools Performance panel
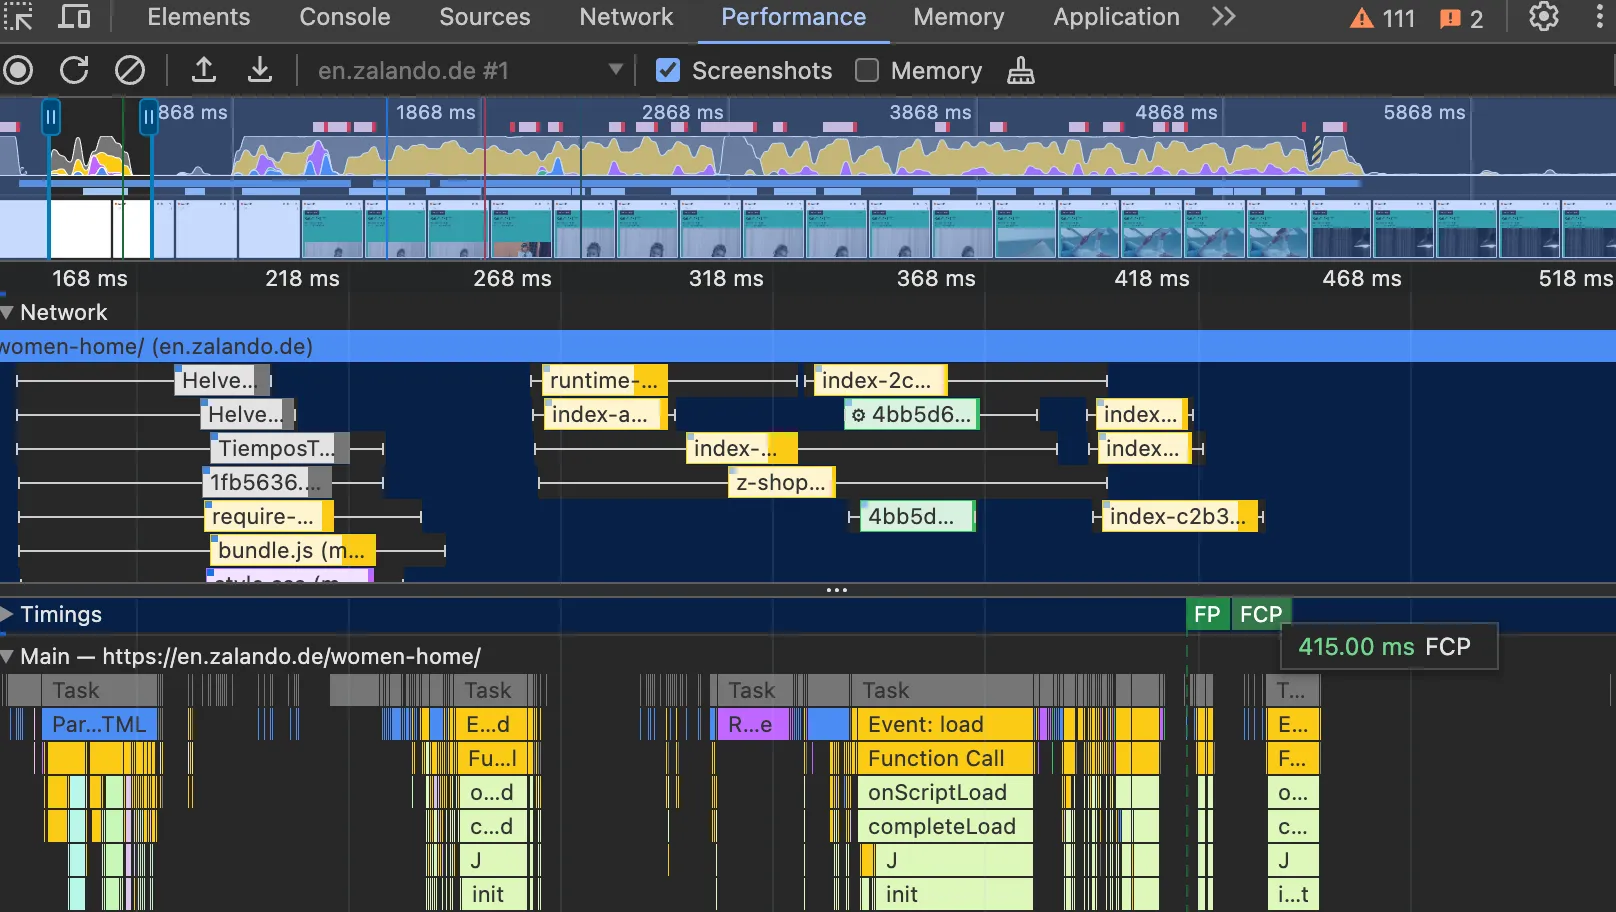
The Chrome Performance panel lets you record performance profiles of your application. Among other things, you can visualize network requests’ waterfall, web vitals markers and main thread activity. It is a wonderful tool for diagnosing performance bottlenecks

Chrome Dev Tools Lighthouse
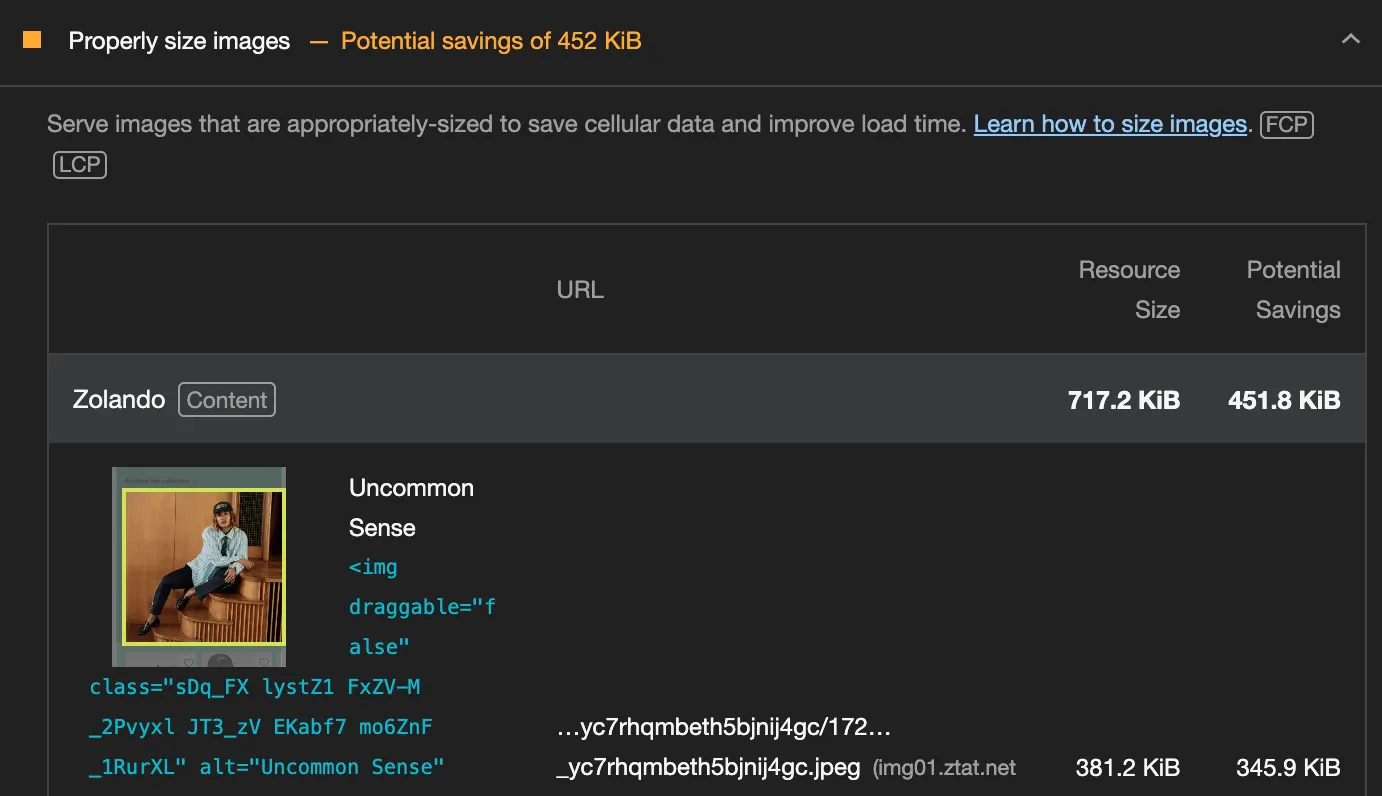
While you should not rely on Lighthouse for web performance metrics and scores, it is a great tool to audit your site and get precise and actionable insights such as potential for image optimization.

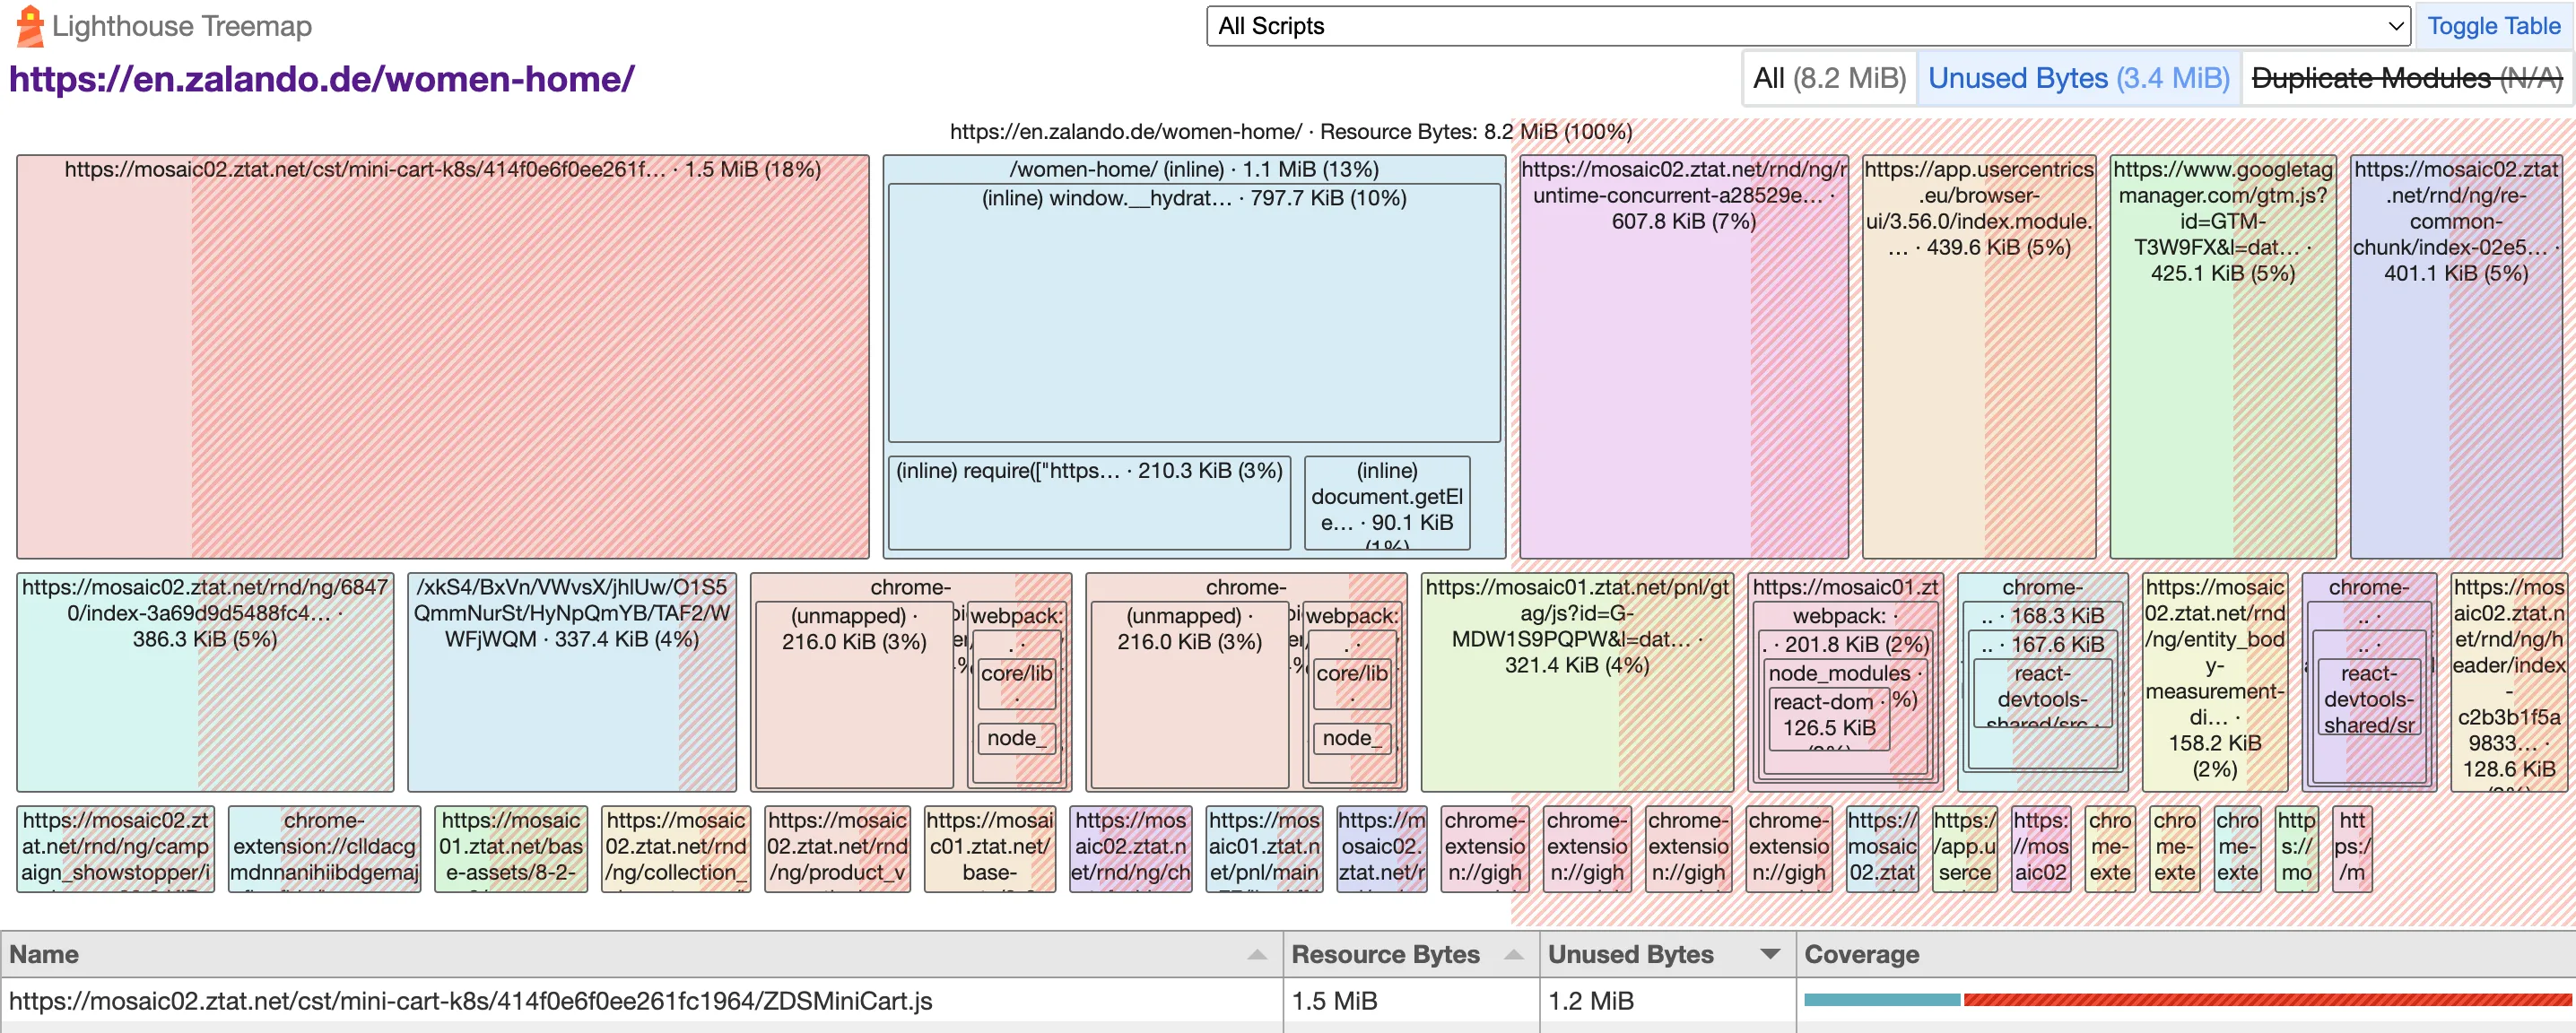
Lighthouse’s audit also provides a link to a treemap view of your site’s JavaScript assets to identify your biggest assets and visualize the amount of unused bytes.

Third-party tools
You can also use third-party tools like DebugBear to get comprehensive diagnostics and recommendations for improving your page load performance.
Common issues and their solutions
Cumulative Layout Shift (CLS)
CLS measures the amount of content that moves after it has already been presented to the user. I like to call CLS the “frustration metric” because we have all experienced content that jumps down when a banner or ad loads at the top of a page, causing us to click on it instead of the content we originally wanted to interact with.
Fortunately, thanks to Chrome DevTools, it’s very easy to reproduce CLS problems on both production and development builds.
- Always set width and height attributes on images and videos so that browsers know exactly how much space they will take when loaded. If you have an image component, make these properties mandatory for developers
- Reserve space for dynamic (late loading) content if you know that you are going to show a dynamic banner ad. This will prevent the content from jumping and solve the frustration problem.
Largest Contentful Paint (LCP)
LCP represents how quickly the main content (relevant hero image or text) loads on your site. It’s the minimum amount of time your user has to wait before seeing relevant content.
Chrome DevTools also helps measure LCP improvements, although the absolute values you get will differ from real users in the field, so make sure to validate relative improvements. The tips here will focus on improving LCP for your hero image, as it’s the most common use case in need of optimization.
- Optimize your images: Find the right balance between image size and quality. You should never load a 2 MB image for a 400x400 slot. Use srcset to serve responsive images, and serve them with a modern format such as AVIF or WebP.
- Make sure the browser discovers and downloads your LCP image early: Use fetchpriority=“high” and avoid CSS background image as well as loading=“lazy” for your hero image candidate.
Interaction to next paint (INP)
INP measures a page’s overall responsiveness to user interactions such as opening accordions, swiping or clicking buttons. It effectively represents how smooth interacting with your site is.
This is the hardest metric to reproduce in a synthetic environment as it’s very hardware dependent but you can get to a good level of reproducibility using Chrome DevTools with CPU throttling on.
- Yield to the main thread often: Use requestIdleCallback (or setTimeout on Safari) to delay execution of code that is not immediately critical.
- Reduce your initial JavaScript footprint: Use code splitting to defer downloading and executing code that is not needed when the page loads, and set a JavaScript size budget for your assets.
Digging deeper
This only scratches the surface, but should give you a good idea of how to get started making your website faster and optimizing your web vitals with low hanging fruits. What you need to fix will depend on your findings and I cannot recommend enough web.dev articles on vitals to dig deeper and get more insight to find what will work for you. I spent a lot of time optimizing Zalando’s website so if you need help improving web performance, reach out!
